
Snakes 'n Ladders
#REF!

Picture a 5×5 snakes and ladders board. (If you’re imagination is bad, then you’re in luck because I have a picture of this below.) You start off the board at position 0, aiming to reach square 25. Each turn, you roll a fair six-sided die (d6), climbing ladders and sliding down snakes along the way. If your roll takes you to or beyond square 25, you win. What is the expected number of rolls it takes to finish the game?
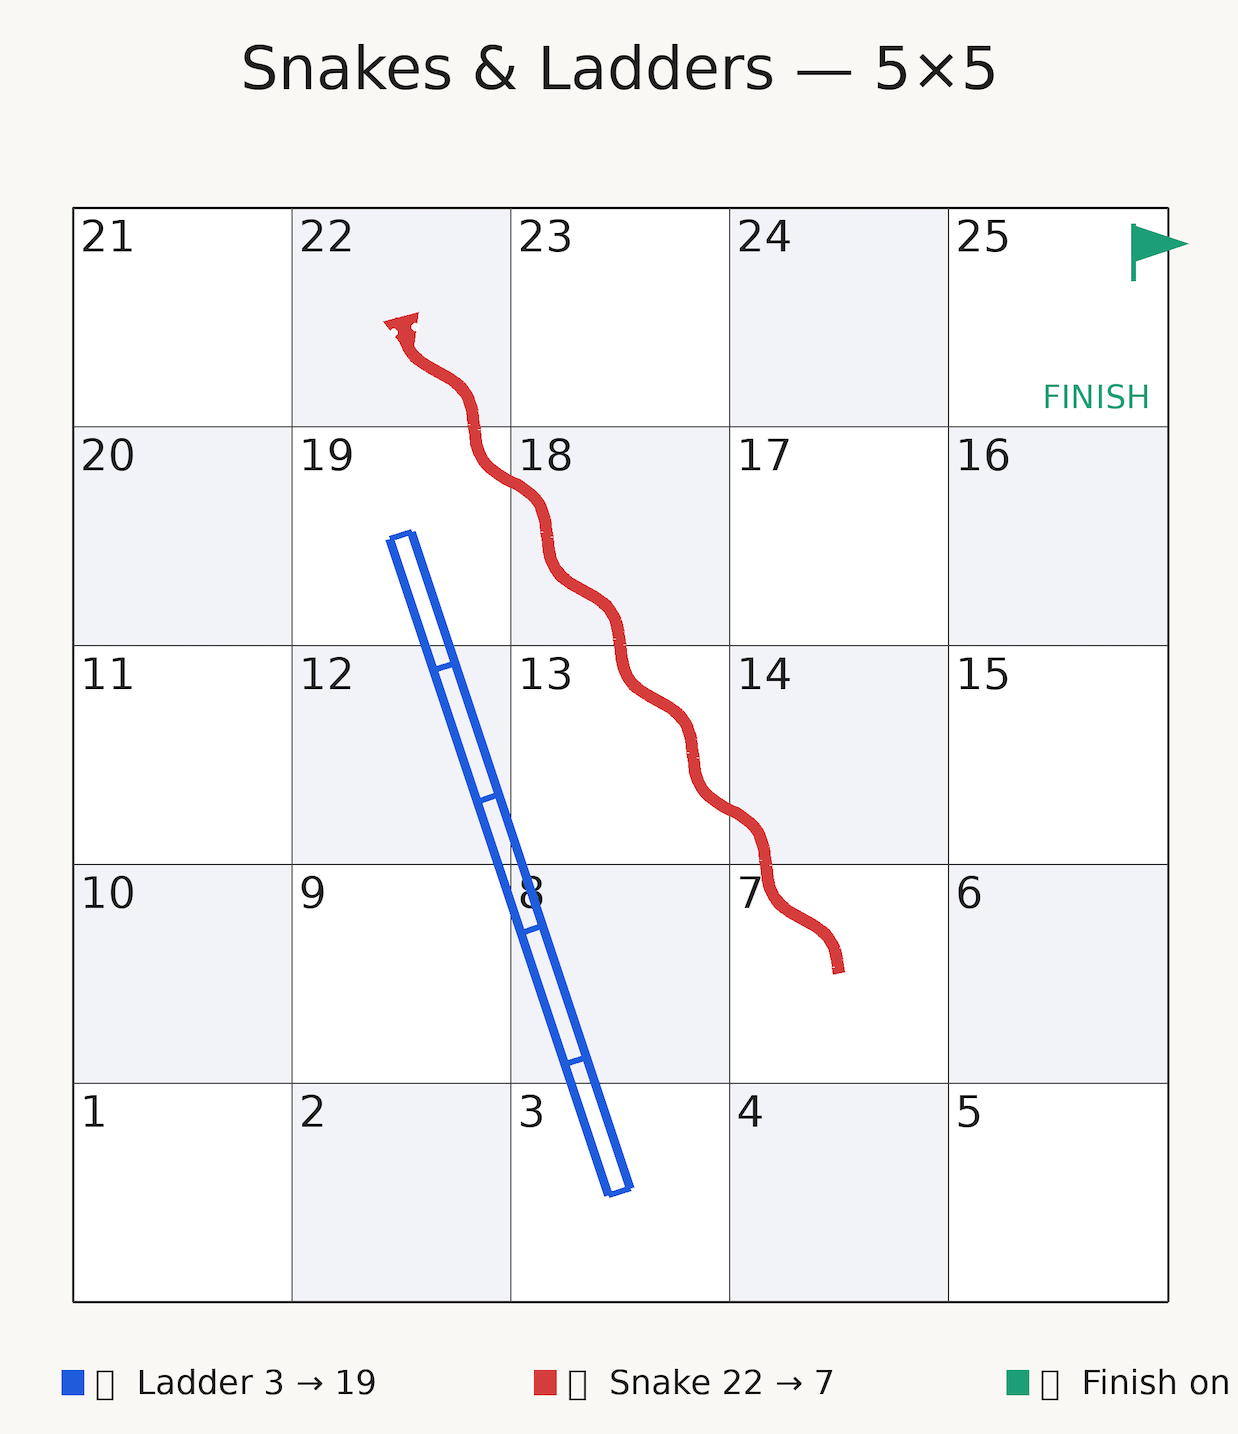
Notice how there is only one snake and one ladder (without ‘cycle-ability’ of going up the ladder and down the snake) to make this easier to calculate.
Breaking it down
Let’s assume that we’re doing this without the snake or ladder for now. What would the expected number of rolls be?
Most people I ask this, end up saying just 25/3.5, but that’s not right, and if it’s not obvious why at first glance, what if the board was of length 2? Would you still think that the expected number of rolls is 2/3.5? Definitely not right? That’s blatantly obviously illogical. The answer to the board of 2 is just 7/6. This is because 1/6 of the time we roll a 1 and then get to >= 2 on the next roll, and 5/6 of the time we get it on the first roll, hence 7/6 rolls in expectancy.
Anyway, just taking the number of positions divided by 3.5 will always underestimate the actual value. This is because we usually land beyond the final value. In other words, we ‘overshoot’ the end in expectation.
We can do a pretty nice mental approximation and just say that we move totally uniformly and continuously. We therefore expect to be uniformly between 0 and 3.5 away from 25 when we take our last roll, so we are 1.75 away from 25 in expectation. Since every roll moves us 3.5 in expectation we ‘overshoot’ 25 by 1.75 (half an expected roll) and thus our expected number of rolls is simply 25/3.5 + 0.5.
We can do an even better approximation though. Let’s assume that we uniformly are 6 away from 25, 5 away from 25, …, 1 away from 25; we have 6 ways to end up 0 past 25 (19+6, 20+5, …, 24+1), 5 ways to end up 1 past 25, …, 1 way to end up 5 past 25.
Our new and improved ‘overshoot’ approximation formula gives us a more accurate value of (25 + 5/3)/3.5.
It is worth noting that we are not perfectly uniform between all of those points, which should be more obvious to see when a board length of n with a very small value of n.
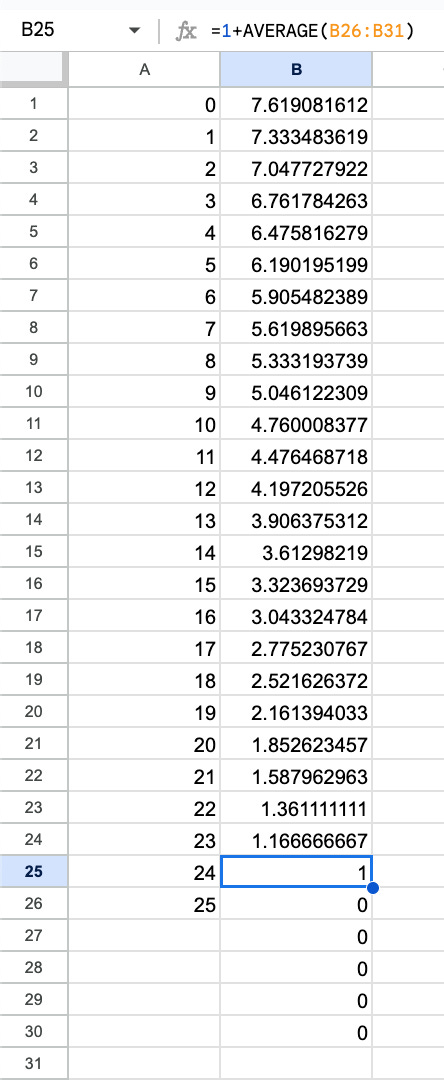
With a recurrence relation and the help of your coding language of choice or Excel/Google Sheets, we can arrive at the exact expectation.
In simple terms, the expectation of the current state is 1 + the average of the expectation across all of our 6 possible rolls, with a total of >= 25 being 0 since we finish at that point.
This isn’t going to be a lesson in how to use Excel/Sheets but, we just set our 0s at the end, enter our formula of 1 plus the average of the next 6 and copy that format up.
Let’s do a quick comparison of the estimates and how they compare to the actual:
Our uniform position approximation was almost spot on.
Okay, now that we’ve done this without the snake or the ladder, let’s add in the ladder.
I think it’s worth noting that if the start of the ladder was not so close to the beginning of the puzzle, assuming that we have a 1/3.5 (uniform assumption) chance of going up the ladder would be more reasonable. I also want to point out how a ladder path taking us to 19 makes the uniform 19-24 assumption worse as well. Nonetheless, let’s use the uniform position approximation (combined w/ our previous uniform position approximation) to carry that logic through the puzzle and also solve it for real.
Let’s say we have a p chance of landing on the base of the ladder, the ladder takes us all the way to 19 from 3, so we reduce our trip by 16p in expectation.
As noted before though, the 1/3.5 assumption is much worse with a starting point so low, so it may make sense to actually spend a little more time calculating p here. We have only 4 ways of reaching 3 ((1,1,1); (1,2); (2,1); (3)) and they happen with total probability 1/216 + 2/36 + 1/6 = 49/216.
And now for the exact, we just adjust our recurrence relation
and do a very simple change in Sheets
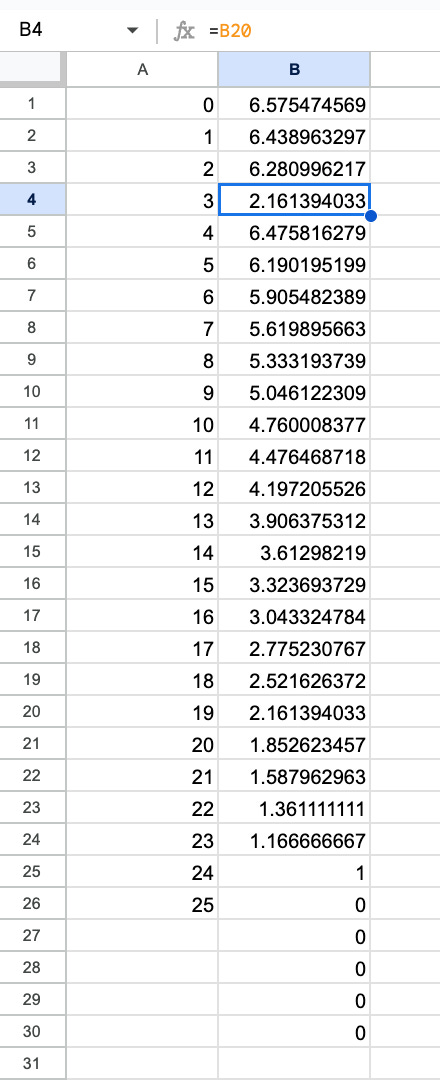
What’s really funny, is that you’ll notice that our “worse” approximation for the ladder is actually closer to the actual. This has to do with how it adjusts the position frequency from 19-24 as also talked about above. Despite me having obviously thought about this question longer than you (the reader) have, I don’t think it’s intuitive as to which would be the better approximation due to the changing of the 19-24 frequency.
Now let’s do the snake. A lot of people treat the snake the same way as the ladder, but you have to realize that you have the chance to keep landing on the snake. The number of times we expect to land on the snake follows a geometric distribution
Under our assumption of uniform probability of landing on any square, p is 1/3.5, hence
The snake adds 22-7=15 additional steps and we land on it 2/5 times in expectation so this adds (2/5)15=6 extra steps in expectation.
Let’s apply the uniform approximation for both the snake and ladder to get our estimate of the total number of rolls:
One important thing to remember to do in both Sheets and Excel, is to change calculations to iterative (you will get #REF! errors if you do not do this), as we are now going to have a self referring feedback loop (remember, we can technically land on the snake an infinite number of times). Once that (very important setting is changed), we just change the square at the top of the snake to be the value at the bottom:
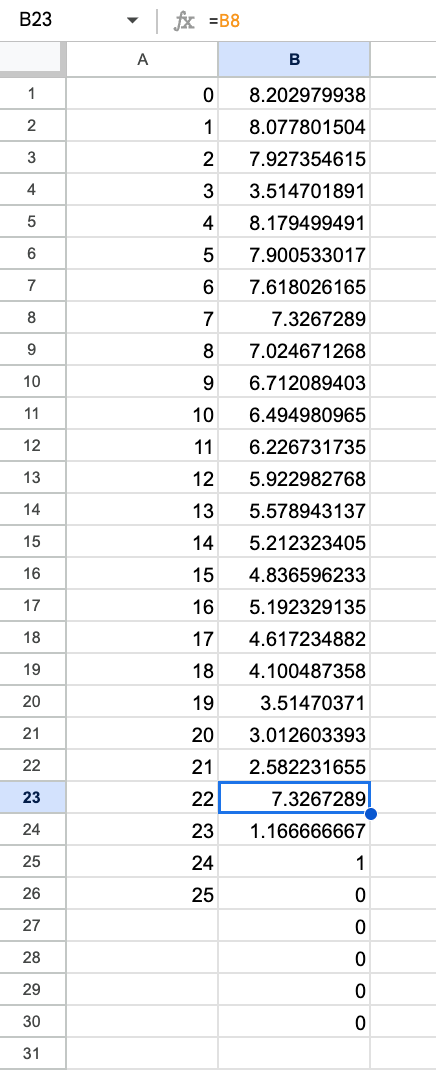
and our approximations actually get pretty close to the actual. Not bad!
Faster (easier) variants of the same concept
Suppose that you keep rolling a d6 until your cumulative sum of all your rolls is >= 1,000, what is the (approximate) probability that your last roll is a 6?
Answer: Well as shown above, we can’t get this exact, but we can get something that is essentially the actual answer because as we get to higher and higher numbers, the distribution of landing at numbers approaches uniform of 1/3.5. Under this uniformity assumption, we are just as likely to be on 994 as we are to be on 996 for example. How many ways can our last roll be a 6? Well we have 6 ways to get to >= 1,000 with a 6 (994 + 6 = 1,000; 995 + 6 = 1,001; …; 999 + 6 = 1005), 5 ways with a 5, …, 1 way with a 1. We therefore have a roughly 6/21 chance that our last roll was a 6.
Suppose that you keep rolling a d6 until your cumulative sum of all your rolls is equal to a target number X (you win), or greater than X (you lose), what is the value of X that maximizes your probability of winning?
Answer: Picking 2 is obviously strictly better than 1 because there is only 1 way to get a 1, but you have a second way or ‘chance’ to get a 2. Let’s denote P_X as the probability of getting X. More precisely for 2, we have P_2 = (1/6)P_1 + (1/6)1. This is because we get 2 instantly with a roll of a 2, and if we roll a 1, well that’s the same thing as just being at the start and picking X=1. We can see how following this logic, 3 is strictly better than 2, 4 is strictly better than 3, … 6 is strictly better than 5. When we get to 7, however, P_7 is just the average of P_1 to P_6 and since P_1 to P_5 are all strictly worse than P_6, we can see how P_7 is strictly worse than P_6. We can do the same logic extended forward a bit before we are 100% confident that X=6 is optimal; We also know that P_X as X → infinity approached 1/3.5.